
By Jessica Keim-Malpass, PhD, RN, Associate Professor, School of Nursing

Dr. Jessica Keim-Malpass
Q. Tell me about what you’re working on now.
A. We have a lot of exciting projects going on right now. One of them is an NIH R21 funded study assessing self-management characterization for children with medical complexity and their social networks (Collaborators include Rupa Valdez from PHS, Lisa Letzkus, and Christopher Lunsford). This study is so important because as many of the pediatric faculty will recognize, we ask families to manage immensely complicated treatment regimens and diagnoses at home, often with little support. This study will lead to interventions that will hopefully enhance care coordination capability for families and providers.
Another very exciting point of intersection with the Department of Pediatrics is the affiliation I have with the Center for Advanced Medical Analytics. I have been lucky enough to work with Drs. Brynne Sullivan, Mike Spaeder, and Karen Fairchild to better understand the best ways to implement and optimize continuous predictive analytics monitoring for neonates and kids at risk for sepsis and clinical deterioration in the NICU and PICU.
Q. Where did you get the idea/why are you passionate about this?
A. I’m passionate about early warning for clinical deterioration because I felt the effects first-hand when I was a nurse in the PICU here at UVA and pediatric hematology-oncology/stem cell transplant at Levine Children’s Hospital in Charlotte. I often talk about a patient, Jordan, that led me to this work directly. I cared for Jordan for many months as he was receiving a stem cell transplant to cure his sickle cell disease. He presented with extremely subtle early signs of sepsis, that we were not able to pick up clinically until it was far too late in his clinical course. I had a gut feeling something was off, but nothing objectively at that point to point towards, and often think of what would have happened if I had a visual risk display (based on machine learning models led by Mike Spaeder, operationalized as a visual through CoMET, photo below).
Q. What is your time frame?
A. We have some grants pending, but I intend that this will be my program of research for the remainder of my career. I’m really interested in physiological markers of recovery and prognosis, and that will be my next work.
Q. What’s your goal?
A. Our short-term goal would be to have a grant-supported visual display of continuous predictive analytics monitoring in the PICU (similar to the STICU example seen in Figure 1) and continue to work with clinician and family stakeholders in these efforts.
Q. What have you learned that you’d want to share with others in the department?
A. I feel so lucky to be a nurse, and to be a scientist, and interface with people who are passionate and altruistic in their desire to improve clinical outcomes. I have gained so much from working with my physician colleagues and view all of my efforts as a total team science model. I think we are so lucky to draw on our own clinical experiences to drive our research. In my own work, I have realized that we are all smart and bring good ideas to the table, but those who are successful are just persistent and the best kind of stubborn! Rejections still sting but I can see how that things have a way of working out with persistence and hard work.
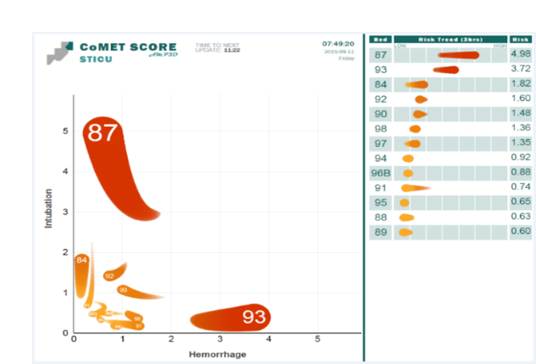
This figure demonstrates an example of a display of the relative risk of patients in an Intensive Care Unit for respiratory (y-axis) and cardiovascular decompensation (x-axis). The current risk is displayed as the head of the comet, and recent trends displayed as the 3-hour tail and is known as the CoMET score.
Filed Under: Features
Tags: JLK2T